
Kubernetes kube-prometheus-stack으로 GPU 자원 모니터링하기(w. DCGM-Exporter)
순서
- kube-prometheus-stack 설치
- DCGM-Exporter 설치
- Grafana DCGM Exporter Dashboard 추가
kube-prometheus-stack 설치는 Helm으로 진행하겠습니다.
1. kube-prometheus-stack 설치
- 기본적으로 Grafana까지 함께 설치되기 때문에 Grafana를 별도로 사용중이라면 values에서 grafana에
enable 옵션을false로 수정합니다.
$ helm repo add prometheus-community https://prometheus-community.github.io/helm-charts
$ helm repo update

# crd 추가
$ helm pull prometheus-community/kube-prometheus-stack --untar
$ kubectl apply -f --server-side=true -f kube-prometheus-stack/crds

# values 설정 변경
$ vi kbe-prometheus-stack/values.yaml
  ...

prometheus:
  ...
  service:
    ...
    type: NodePort # prometheus section 아래 service section 아래 service type을 ClusterIP에서 NodePort로 변경
    ...
  ...

  serviceMonitorSelectorNilUsesHelmValues: false  # false로 설정해야 Helm 외 전체 서비스 모니터링 가능

  ...

  # additionalScrapeConfigs 찾아서 GPU metric 수집을 위한 설정 추가
  additionalScrapeConfigs:
  - job_name: gpu-metrics
    scrape_interval: 1s
    metrics_path: /metrics
    scheme: http
    kubernetes_sd_configs:
    - role: endpoints
      namespaces:
        names:
        - gpu-operator
    relabel_configs:
    - source_labels: [__meta_kubernetes_pod_node_name]
      action: replace
      target_label: kubernetes_node


$ helm install prometheus-community/kube-prometheus-stack \
    --create-namespace --namespace prometheus \
    --generate-name --values kube-prometheus-stack/values.yaml
2. DCGM-Exporter 설치
- 설치되는 DCGM-Exporter 버전에 따라 Pod가 계속 Pending에 빠지는 initalize timeout 오류가 발생할 수 있습니다.
이때는 Daemonset의livenessProbe와readinessProbe의initialDelaySeconds를 각각 60초 이상으로 설정하면 됩니다.
$ helm repo add gpu-helm-charts https://nvidia.github.io/dcgm-exporter/helm-charts
$ helm repo update
$ helm install --generate-name -n prometheus gpu-helm-charts/dcgm-exporter
DCGM-Exporter가 잘 설치되었는지 확인해보기 위해서 prometheus에 접속해보겠습니다. Kubernetes Service에서 prometheus-operated를 port forwarding해서 확인하면 됩니다. DCGM이라고 입력했을 때 아래와 같이 다양한 metric이 보이면 잘 설치된 것입니다.
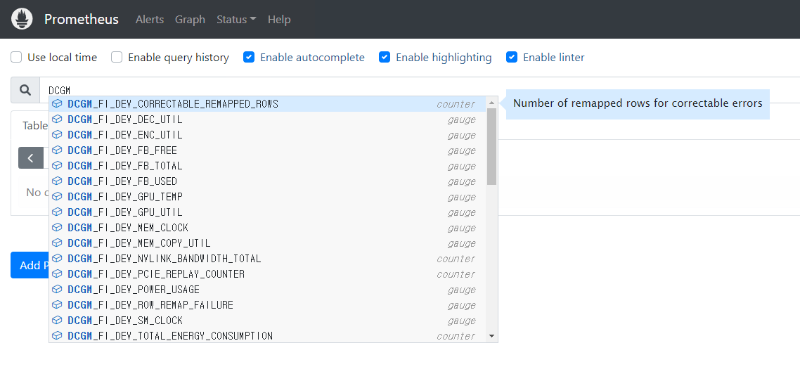 prometheus web ui
3. Grafana 모니터링
- 모니터링에 필요한 dashboard는 Grafana dashboard에서 DCGM으로 검색해서 찾으면 됩니다. 여기서는 아래 dashboard를 사용했습니다. dashboard에 아래 dashboard ID를 복사해서 추가하면 됩니다.
- https://grafana.com/grafana/dashboards/12239-nvidia-dcgm-exporter-dashboard/
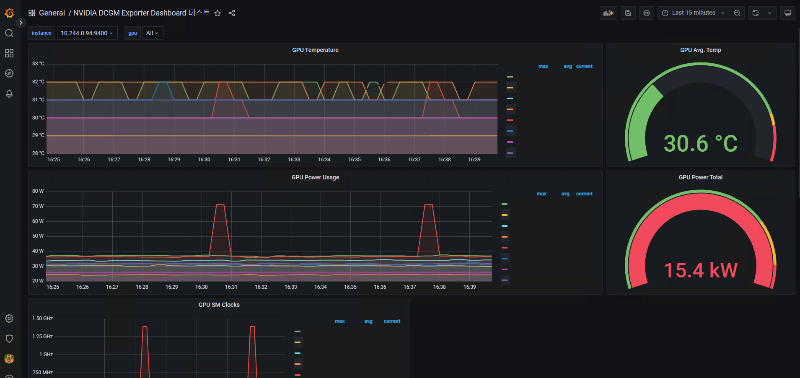 Grafana Dashboard
Reference
- https://docs.nvidia.com/datacenter/cloud-native/gpu-telemetry/dcgm-exporter.html
- https://nvidia.github.io/gpu-monitoring-tools/
댓글남기기